Social Media Metrics: What to Track and How to Use Them
Learn which social media metrics to track, how to calculate key rates and how to connect reach, engagement, clicks and conversions to business decisions.
On this page
- Key takeaways
- Choose social media metrics around your business goal
- Awareness and audience metrics
- Engagement and video attention metrics
- Traffic and action metrics
- Conversions, qualified outcomes and business value
- Additional metrics for paid campaigns, customer care and brand feedback
- Read the numbers together before changing the plan
- Where to find the data for each part of the journey
- Compare performance on a consistent basis
- Frequently asked questions
- Turn useful metrics into a clear next check
A social post can reach more accounts, attract more comments and send fewer people to your offer. Whether that is a useful result depends on what the post was meant to accomplish.
Social media metrics help you answer three questions: what changed, did it support the goal, and what should you check next? Start with a few measures tied to awareness, audience interaction, traffic or a defined business action. Then read their counts, rates and context together.
A metric is a measure, such as reach or link clicks. A key performance indicator, or KPI, is a metric you select to evaluate a particular goal. Every number in a dashboard does not need to become a KPI.
Choose social media metrics around your business goal
Use your objective to choose a main measure, then add enough context to interpret it.
| Goal | Main measures | Supporting context | Decision to investigate |
|---|---|---|---|
| Reach a relevant audience | Reach or the source’s unique-audience measure; views or impressions | Network, format, audience relevance, paid versus organic distribution | Is the content reaching the intended audience? |
| Improve useful audience interaction | Included interaction types and a defined engagement rate | Comment meaning, saves/shares where available, original content | Which themes or formats deserve another test? |
| Bring people to an offer or useful destination | Outbound clicks, matching link CTR, destination activity and website sessions | Click definitions, campaign tags and the destination | Where does movement toward the intended action weaken? |
| Generate valuable inquiries or sales | Defined completed actions, their rate and qualified outcomes | Form/event configuration, qualification, attribution and costs | Are the measured actions useful to the business? |
| Improve customer response service | First meaningful response time and outstanding actionable work | Coverage hours, unanswered questions and escalation records | Are customers receiving useful help? |
Choose the rows that fit your work. A brand-awareness post and a booking promotion can have different primary measures, even when they appear on the same account.
Awareness and audience metrics
Reach, impressions and views
Reach describes the audience your source counts as having seen the content within a stated scope. Depending on the platform, it may be an estimated or deduplicated account, member or viewer measure. Read it at the level shown: one post, an account or a reporting period.
Impressions count qualifying displays, including repeat exposure. They do not prove that someone read or understood the content.
Views depend on the platform and format. A view is not necessarily a unique person or someone who deliberately pressed play. For example, YouTube distinguishes views, engaged views and thumbnail impressions: first-frame playback can count as a view, while engaged views reflect clicking to watch or watching beyond the initial seconds. Simply seeing a thumbnail is a different event.
Do not add the reach of several posts and call the result unique campaign reach. The same account may have seen more than one post. Audience overlap also prevents a simple sum of several platforms’ reach from becoming a count of unique people.
How to use these metrics: investigate distribution and audience fit, then look at the interaction or next action relevant to the goal. Increased exposure can support awareness, but it does not by itself establish sales or lead quality.
Follower count, net growth and growth rate
Follower count provides audience context. Its usefulness depends on who is following, how that audience changes and what the business wants to achieve.
Use these calculations when measuring net growth over a period:
Net follower change = ending follower count − starting follower count
Net follower growth rate = net follower change ÷ starting follower count × 100
For illustration, moving from 1,000 to 1,100 followers is a net increase of 100 and a 10% net growth rate. Gross new follows tell a different story because they do not subtract unfollows.
If you start at zero, report the number gained. Percentage growth from that zero starting point is not calculable.
For a total across connected accounts, compare a stable account set. Adding an account can increase the displayed total even if no account gained followers. The sum also does not deduplicate someone who follows the business on several networks.
How to use these metrics: examine audience changes alongside content, relevant interactions and business outcomes. A larger follower count is neither automatically worthless nor proof that more potential buyers saw a particular post.
Engagement and video attention metrics
Interaction counts and engagement rate
Interaction counts describe actions such as reactions, comments, shares and saves. Some sources also include clicks. Check which actions your source includes before comparing totals or rates.
A clearly defined impressions-based calculation is:
Engagement rate by impressions = included interactions ÷ impressions × 100
A rate based on reach or followers uses a different denominator. Consider this illustrative example:
| Calculation | Result |
|---|---|
| 200 interactions ÷ 5,000 reached accounts × 100 | 4% |
| 200 interactions ÷ 10,000 impressions × 100 | 2% |
The activity did not change. The calculation changed. Neither percentage alone shows an improvement or decline.
Interactions are not necessarily unique people, and a high count can include complaints or negative reactions. Read what people are responding to as well as how often they respond.
For a combined rate, use compatible counts and recalculate the stated ratio. Simply averaging post percentages can give a misleading result because the denominators may differ. Keep incompatible network definitions separate, and do not turn summed post reach into unique campaign reach.
How to use these metrics: compare similar content on a consistent basis, then inspect the response. A useful question is which topic generated relevant discussion or sharing, rather than whether one percentage clears a universal engagement target.
Watch time, average view duration and retention
Video views help describe distribution. Attention metrics add information about what happened after playback began.
- Watch time: accumulated viewing time under the source’s rules.
- Average view duration: the source’s average amount of time watched.
- Retention or completion: how viewing continues through a defined part of the video or reaches its ending.
Use the platform’s definitions and denominators. A public view count is not automatically the denominator used for average duration or completion, and every platform does not apply the same completion formula.
Compare similar formats and lengths. Completing a short clip and spending several minutes with a longer explanation are different attention outcomes.
How to use these metrics: look for where attention drops, then decide what to test in the opening, length or explanation. A drop-off suggests a question to investigate; it does not establish the cause by itself.
Traffic and action metrics
Outbound clicks and click-through rate
A total labeled “clicks” may include actions that never take someone to your intended website. Distinguish all clicks from clicks on a link or outbound destination.
When matching data is available, use a specifically named calculation:
Outbound-link CTR = outbound-link clicks ÷ matching impressions × 100
The clicks and impressions should refer to the same content or campaign, period and scope. Do not divide lifetime profile clicks by this month’s post impressions and treat the result as that post’s CTR.
A click on a link inside a Linkme page also happens at a different stage from an outbound click on a social post. A page’s displayed click rate should not be presented as the post’s click-through rate or assigned a guessed formula.
How to use these metrics: check whether the audience has a relevant reason and clear route to the destination. A higher click rate can be useful for traffic, but the quality of the resulting actions still matters.
Website sessions from social
A session is a period of measured activity on a website or app. One person can produce several sessions, and a platform click is a different unit from a measured session.
Consistent source, medium and campaign tags can help identify social traffic when a working analytics setup captures them. UTM parameters label the link’s campaign information; they do not independently measure a purchase or reconstruct every customer journey.
Google Analytics’ Traffic acquisition report helps examine session sources. Keep session acquisition separate from first-user acquisition and event-attribution reporting when comparing results. Social traffic can appear under different channel classifications; it is not all necessarily labeled Referral.
Click and session counts can differ because of measurement coverage, consent, redirects, repeat activity and reporting scope. A mismatch gives you something to investigate, rather than proving one source is wrong.
How to use this metric: inspect what happens after measured social sessions arrive. Relevant next checks include the destination they reach and the defined action they complete.
Conversions, qualified outcomes and business value
Define the action before calculating its rate
A form submission, booked demo, qualified lead, sales opportunity and purchase are different outcomes. Choose the action that matters to the goal and name it precisely.
If you capture leads on your Linkme page, distinguish the capture record from what happens afterward. A submission is not automatically a new unique contact, a qualified prospect or proof of the originating social campaign. Qualification and sales records answer those later questions.
Website measurement also needs the relevant action configured. In GA4, a collected event can be marked as a key event because it matters to the business. That setting does not independently validate the form submission or qualify the person.
One useful rate is:
Session key event rate = sessions containing the selected key event ÷ total sessions in the same segment and period × 100
Count each qualifying session once in the numerator. For this hypothetical campaign:
| Measure | Count |
|---|---|
| Measured campaign sessions | 1,000 |
| Recorded form-submit occurrences | 30 |
| Sessions containing at least one form-submit event | 24 |
The session form-submit key event rate is 24 ÷ 1,000 × 100 = 2.4%. Dividing 30 occurrences by 1,000 sessions produces 3%, but that is a different calculation. Form records or data from your customer relationship management (CRM) system are still needed to establish unique and qualified leads.
If the denominator is zero, report the zero count and mark the rate not calculable. Investigate measurement if that zero is unexpected. Keep this distinct from missing or unavailable data.
Separate attributed revenue, ROAS and ROI
Where revenue or qualified outcomes are tracked, state the attribution scope, model and window that give social credit. An eventual conversion does not have to happen during the first or same visit.
Return on ad spend (ROAS) uses this revenue-based calculation:
ROAS = attributed ad revenue ÷ ad spend
If the numerator is an assigned value for a lead rather than actual revenue, label that value accordingly.
Return on investment (ROI) requires a financial model that accounts for return and relevant costs. Revenue divided by ad spend does not establish profit. Product fulfilment, production, software and campaign costs may affect the business calculation, depending on the model used.
Attribution allocates credit under measurement rules. Establishing additional outcomes caused by marketing requires suitable causal evidence. Avoid adding conversions claimed by several platforms and calling the sum unique customers.
How to use these measures: assess the defined business outcome with its quality, cost and measurement basis. More clicks or traffic alone does not establish ROI.
Additional metrics for paid campaigns, customer care and brand feedback
These measures become useful when your team does the corresponding work. They do not all need to appear in every business’s regular review.
| Work your team does | Useful measures | Calculation or interpretation rule |
|---|---|---|
| Runs paid campaigns | Cost per click, cost per thousand impressions, cost per defined action and ROAS | CPC = spend ÷ clicks of the named type. CPM = spend ÷ impressions × 1,000. Cost per action = spend ÷ count of the defined action. Match the campaign, period and attribution basis. |
| Handles customer conversations | First meaningful response time, response coverage and outstanding work | Define which conversations are eligible and what counts as a response. Read averages alongside unanswered cases and the oldest waiting work. |
| Tracks wider brand discussion | Mention volume, recurring topics, sentiment and share of voice where measured | Keep monitored brands, sources and periods consistent. Share of voice refers to that defined set, rather than the entire market. Review the context behind sentiment labels. |
An automatic acknowledgement is not necessarily a useful customer-service answer. Similarly, a sentiment classification is not a customer-satisfaction survey.
If your business already collects customer satisfaction scores (CSAT), Net Promoter Score (NPS) or repeat-customer data, those measures can add context. They require their own collection and definitions; they should not be inferred from likes or comment sentiment.
Read the numbers together before changing the plan
Exposure rises, but useful actions do not
Imagine a post reaches a larger audience while outbound clicks and meaningful responses stay flat. Check audience relevance, the post’s context and its intended action.
If the goal was awareness, the extra distribution may still be useful. If the goal was inquiries, investigate the reason and route for taking the next step. Neither result alone identifies the cause or tells you to discard the format.
Measured traffic grows, but inquiry completion is flat
Imagine a promotion attracts more measured website sessions while completed inquiries remain unchanged. Compare the same traffic segment and action definition, then examine destination relevance, form usability and measurement.
Check the inquiry records too. More submissions would not automatically mean more qualified opportunities. These observations suggest what to investigate; they do not prove the social post or destination page caused the outcome.
Where to find the data for each part of the journey
Use the source that measures the part of the journey you are asking about.
| Your question | Appropriate source | Measurement boundary |
|---|---|---|
| Who saw or interacted with the social content, and how did video attention change? | Native platform analytics or a tool with verified access to those exact fields | Labels and definitions can vary across networks and formats |
| How many visits do our Linkme pages receive, which links are clicked, and how does that change? | Linkme Analytics for activity on Linkme pages | Page visits and link clicks are different from native social reach, impressions or engagement |
| Which measured website sessions and selected key events follow social traffic? | Configured website analytics such as GA4 | Clicks need not equal sessions, and an event need not equal a qualified lead |
| Which inquiries qualify, become opportunities or generate revenue? | Form records, CRM, booking/sales or ecommerce systems | Capture records alone do not establish the original campaign or causal impact |
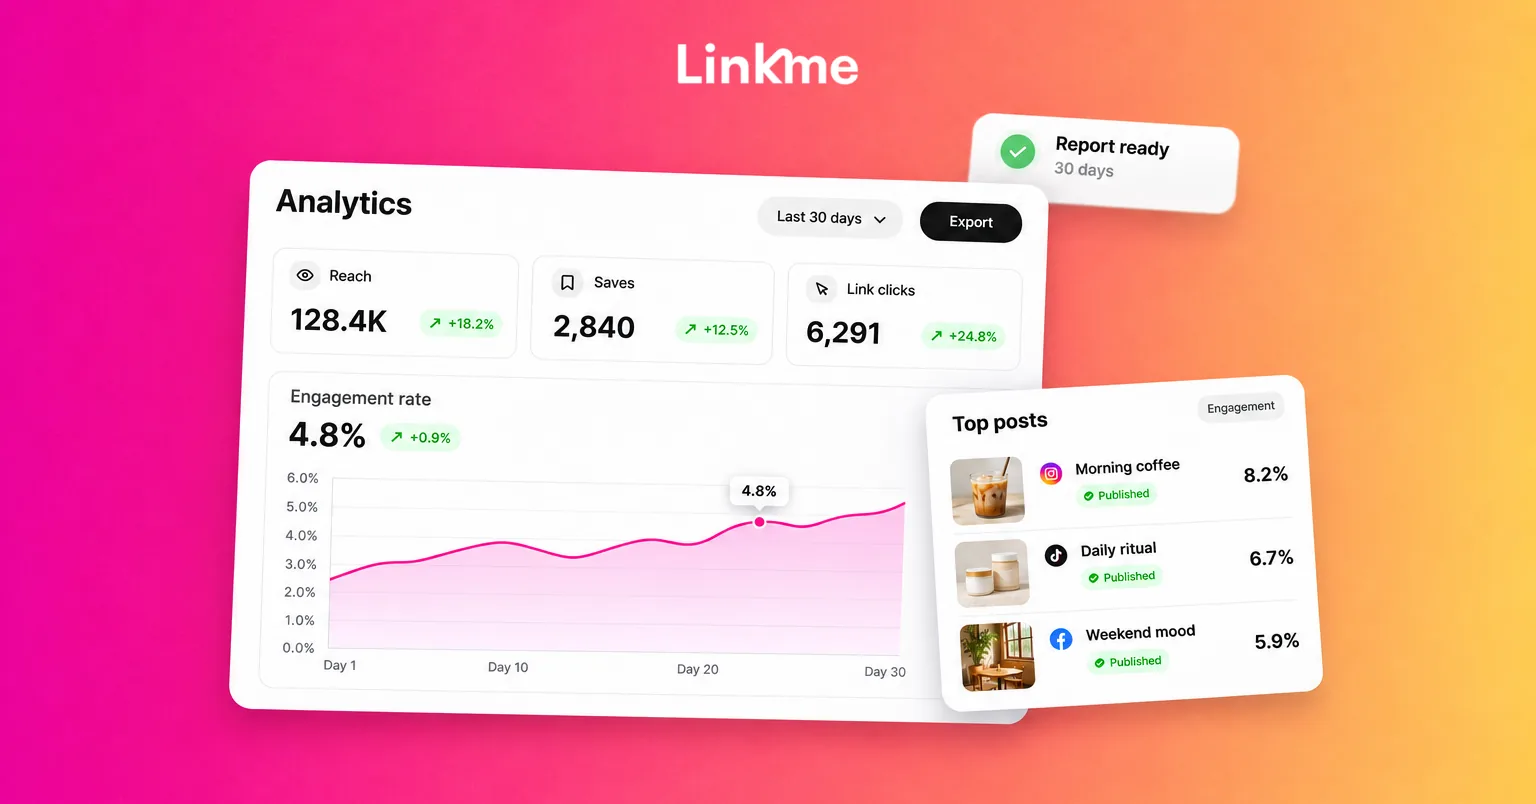
Linkme Analytics supports the destination-page part of that measurement. Page visits, ranked link clicks and period comparisons help a business see which links attract action and how page activity changes.
For example, a business sending social visitors to pages for different locations or offers can review those page and link records before checking relevant inquiry or sales records. Those are complementary steps; they do not imply an automatically joined attribution system.
Keep native reach and engagement in the appropriate social source, and use destination activity to answer what happened on the page. This gives the business a useful measurement path without treating every dashboard as if it measures the same stage.
Compare performance on a consistent basis
For each selected metric, record the source, account/page/post scope, period, included actions and calculation. A short definition note helps colleagues read the result consistently.
Compare suitable periods, formats, audiences and paid versus organic results. Changes in spend, publication volume or measurement definitions can affect the apparent trend.
Always inspect the counts behind a percentage, particularly for small samples. A rate moving from 2% to 3% increases by one percentage point, or 50% relative to its starting rate. Say which change you mean.
Keep measured zero, missing data and a rate that cannot be calculated separate. If tracking or a platform definition changed, examine that before interpreting a performance shift. Avoid applying a universal target rate to different networks, formats and business goals.
Finally, preserve the source’s scope for unique audiences and credited outcomes. Follower totals, reach and attributed conversions cannot simply be added into a count of unique people or customers.
Frequently asked questions
Which social media metrics matter most for a business?
Choose a main measure tied to the goal, with supporting context. Awareness may call for reach and audience relevance; a traffic goal needs destination actions; an inquiry goal needs a defined completed action and qualification checks. The goal determines the priority.
What is the difference between a social media metric and a KPI?
A metric is a measure. A KPI is a metric selected to evaluate a particular goal. An available dashboard number becomes useful as a KPI when the team agrees what objective it helps assess.
How do you calculate engagement rate?
Specify the interactions included and the denominator. Interactions divided by impressions, reach or followers are different calculations. Use a consistent definition for the comparison and check the source’s own formula.
Why do social clicks and website sessions differ?
They count different units through different measurement systems. Tracking coverage, consent, redirects, repeat activity and reporting scope can affect the relationship. Compare the matching campaign and period before investigating the difference.
Can social media metrics prove ROI?
Outcome, cost and attribution evidence can support a defined ROI calculation. Traffic and engagement alone do not establish profitability, and attributed outcomes alone do not prove the additional results caused by marketing.
Turn useful metrics into a clear next check
Define the goal, choose a few relevant measures and read them with their counts, sources and context. Use the result to identify the next question or test, rather than treating a single percentage as a complete answer.
Explore Linkme for Business to see how page analytics can support your social measurement. Book a demo to discuss your pages and reporting needs.